Capture, Not Dwell: What the RevPAG Argument Misses in Thailand
Answer in brief: Designing a hotel to hold guests on property for longer is a reasonable idea, but it is a revenue argument rather than a profit argument. Pattaya has just demonstrated where the money actually is. In the first half of 2026 the market delivered RevPAR growth of 7.79%, led by rate rather than volume, with luxury commanding an ADR premium of 48.8% over the market average. Rate premium on a room already sold reaches profit almost intact. Outlet revenue does not. Before an owner adds seating, covers and kitchen, the questions are whether on-property dwell can actually be created, whether it converts at a margin worth having, and whether that square metre would earn more doing something else.
Key takeaways
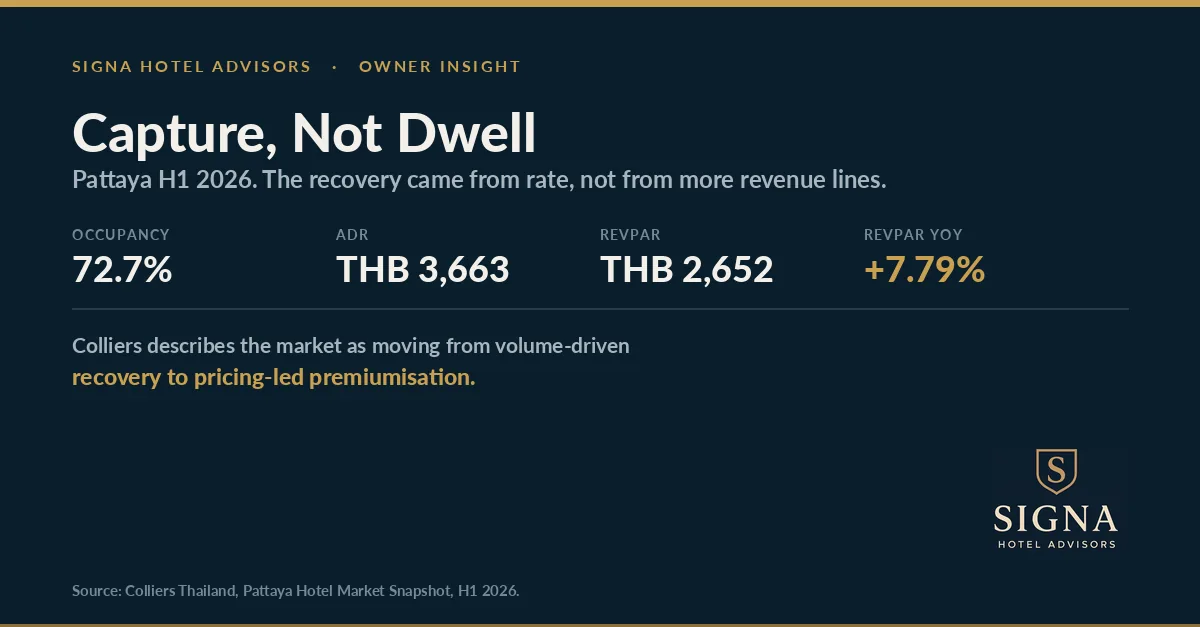
- Pattaya recorded 72.7% occupancy, ADR of THB 3,663 and RevPAR of THB 2,652 in the first half of 2026, with RevPAR up 7.79% year on year, according to Colliers Thailand.
- Colliers describes the market as moving from volume-driven recovery to pricing-led premiumisation, led by luxury and the emerging resort zones.
- Luxury achieved an ADR of approximately THB 5,450, a 48.8% premium over the market average.
- The market is splitting. Luxury and upper-upscale growth is now driven by ADR. Upscale and midscale growth remains dependent on occupancy, with ADR constrained by supply, serviced apartments, boutique product and short-term rentals.
- Na Jomtien is identified as the highest-potential zone for medium-term ADR growth, driven by new luxury and lifestyle resort supply.
- South Pattaya and Jomtien form a competitive midscale cluster with RevPAR trailing other zones and occupancy concentrated at weekends.
- Length of stay is not dwell time. C9 Hotelworks recorded a 2.4 night average stay in Pattaya in 2024. That tells you how long the trip lasts, not how many hours the guest spends inside monetisable hotel space.
- Food and beverage already represents around 25% of Thai hotel revenue, with rooms at 65% to 70%, according to Krungsri Research.
- In our experience reviewing resort assets and development briefs across Thailand, overspecified F&B capacity is a recurring ownership risk.
Length of stay and dwell time are not the same variable
Before anything else, a distinction that most of this debate skips.
Average length of stay measures how many nights the guest books. Dwell measures how many of those hours are spent inside the hotel, and more precisely inside spaces where the hotel can earn something. A guest on a 2.4 night stay might spend almost the entire time on property, or might leave after breakfast and return at midnight. The two numbers answer different questions.
That matters because the owner has to test two things separately, not one.
First, can additional on-property dwell actually be created at this property, for this guest, in this location. Second, if it can, does converting that time into spend generate enough incremental contribution to justify the capital and the space it consumes.
Most dwell arguments answer neither. They assert the first and assume the second.
Where the famous number comes from
The dwell argument travels with a statistic. One percent more dwell time, 1.3% more spend.
That figure comes from research conducted in 2007 by Path Intelligence in collaboration with MIT, which tracked shopper movement in a UK mixed-use shopping centre and found that a 1% increase in average daily dwell was associated with a 1.3% increase in total centre sales. It is a retail finding, from one centre, and it is frequently attributed to McKinsey.
That does not make it useless. It makes it a mall number.
The dwell elasticity measured in a travel setting behaves differently. Research published in the Journal of Air Transport Management found that a 10% increase in passenger dwell was associated with roughly a 4% to 5% increase in total non-aeronautical revenue, with food and beverage responding more strongly at around 8% and retail at around 6%. Terminal configuration materially changed the elasticity, which were roughly double at linear-design terminals compared with finger pier layouts.
Note what that says. Dwell does convert, and it converts better into F&B than into retail. It also says the conversion rate is a function of layout and format rather than a universal constant. The airport that redesigns its terminal changes its own elasticity.
The question for a hotel owner is not whether the relationship exists. It is what the relationship is worth at their property, net of what it costs to build.
What Pattaya just proved about where the money is
Colliers Thailand published its Pattaya market snapshot for the first half of 2026 in July. The headline numbers are healthy.
| Pattaya, H1 2026 | Result |
|---|---|
| Occupancy | 72.7% |
| ADR | THB 3,663 |
| RevPAR | THB 2,652 |
| RevPAR change year on year | +7.79% |
That is a recovering market, not a struggling one. International arrivals are returning, led by Russian, Indian, Chinese and European leisure demand.
The important detail is how the growth arrived. Colliers characterises Pattaya as transitioning from volume-driven recovery to pricing-led premiumisation, led by luxury and the emerging resort zones. Growth is coming from rate.
And rate is where the margin lives.
The rate premium is the benchmark any outlet has to beat
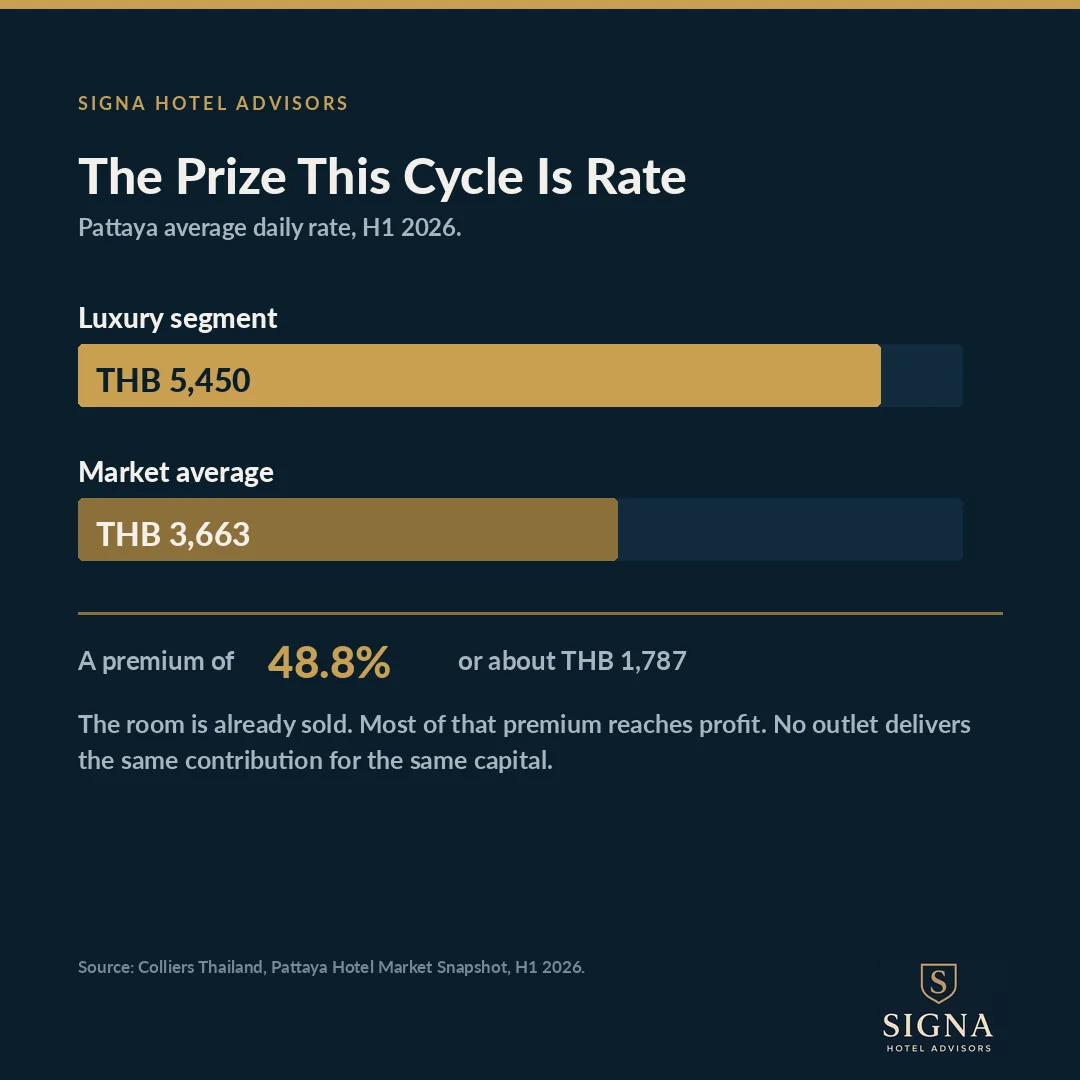
Colliers puts the luxury segment ADR at approximately THB 5,450 against a market average of THB 3,663. That is a 48.8% premium, and in absolute terms roughly THB 1,787 per occupied room night.
Consider what that premium costs to deliver. The room is already sold. Housekeeping, laundry, amenities and front office cost the same at THB 5,450 as at THB 3,663. Commission and card fees scale with revenue, so the premium is not entirely free, but the overwhelming majority of it reaches departmental profit.
Now consider what it takes to produce the same contribution from an outlet. Every cover carries product cost. Labour is step-variable rather than fixed, so an extra table in an already-staffed restaurant costs little, but adding capacity means adding staff, and the kitchen, the seating and the space carry cost whether they trade or not.
To match roughly THB 1,787 of contribution per occupied room night through food and beverage, a property needs several times that in incremental outlet revenue. That is not a criticism of F&B. It is arithmetic, and it establishes the hurdle rate any new outlet has to clear.
Pattaya's own market data says the achievable prize this cycle is rate. An owner spending capital on covers while leaving rate on the table has the priority inverted.
The market is splitting, and the advice should split with it
Colliers is explicit that luxury and upper-upscale properties have returned to pre-downturn performance with growth increasingly driven by ADR, while upscale and midscale face pricing pressure from intense competition, leaving their growth more dependent on occupancy gains than on rate.
That divergence shows up geographically.
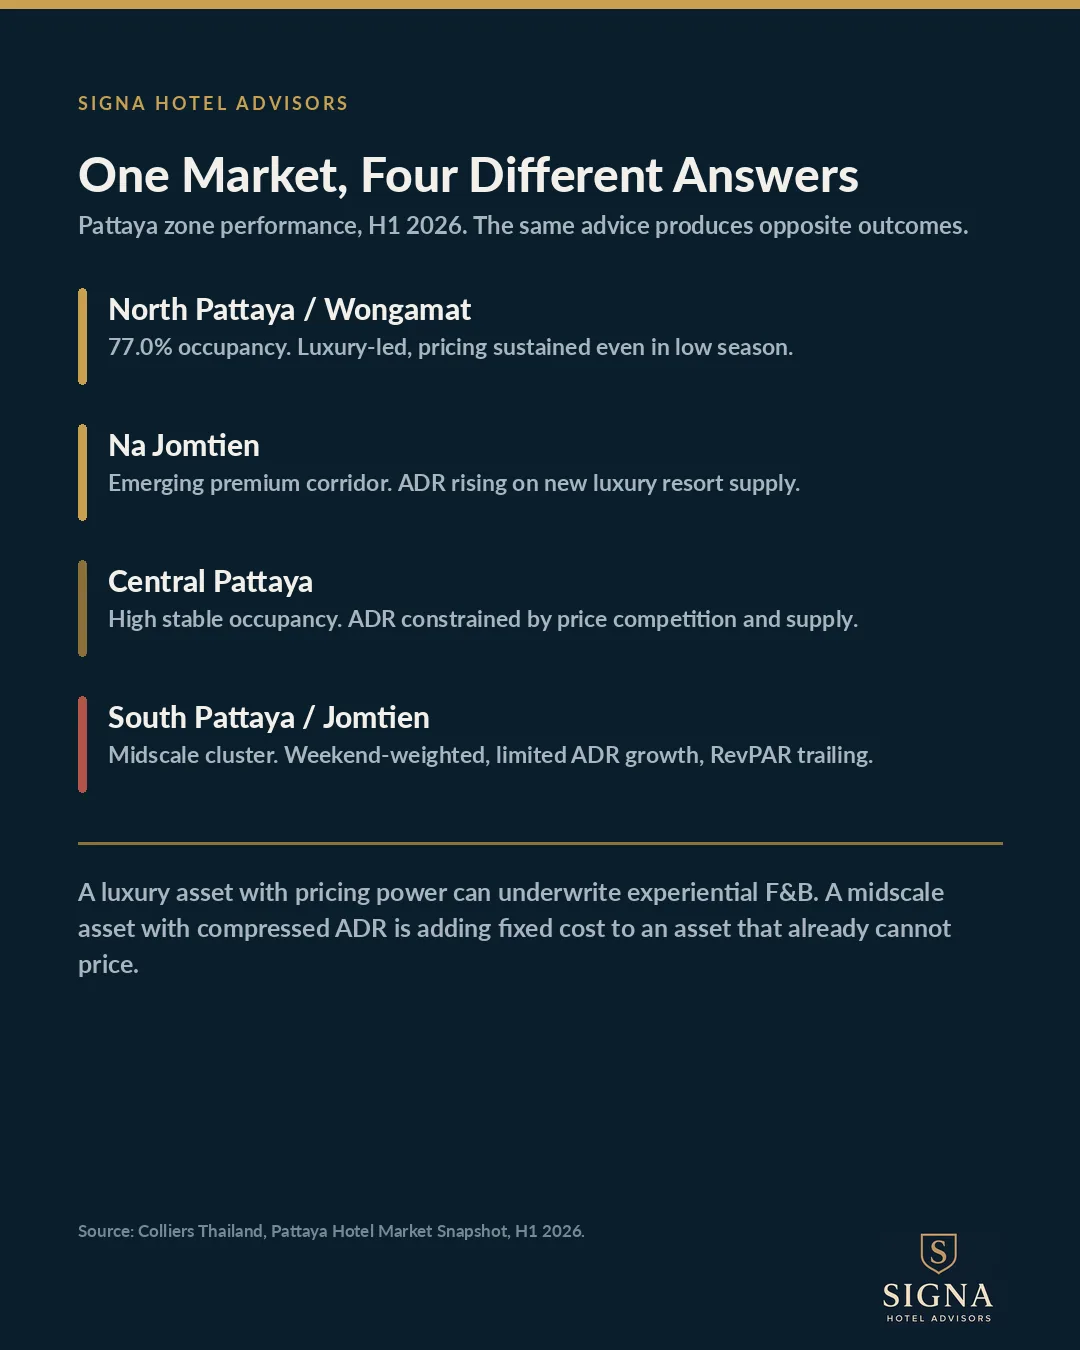
North Pattaya and Wongamat recorded 77.0% occupancy, above the city average, on luxury-led demand from Russian and European visitors and high-end family travellers, with pricing sustained even in low season.
Central Pattaya remains the largest and most diverse market, with high and stable occupancy but ADR growth constrained by price competition and supply concentration. Older properties are under pressure from new and recently renovated competitors.
South Pattaya and Jomtien form a competitive midscale cluster driven by nightlife and short-stay demand, with occupancy concentrated at weekends, limited ADR growth and RevPAR trailing other zones.
Na Jomtien is the emerging premium resort corridor, with ADR rising significantly on new luxury and lifestyle resort supply and Bangkok weekend demand. Colliers identifies it as one of the highest-potential zones for medium-term ADR growth.
Two owners can receive identical dwell advice and get opposite outcomes.
A luxury property in North Pattaya or Na Jomtien with rising ADR and a destination outlet that draws external demand can underwrite experiential F&B, because it has pricing power to compound and a guest with the wallet to match.
A midscale property in South Pattaya or Jomtien, with ADR compressed by supply and by competition from serviced apartments, boutique hotels and short-term rentals, and with occupancy concentrated on Friday to Sunday, cannot. Its problem is a rate and positioning problem caused by oversupply. Adding an outlet does not fix a rate problem. It adds fixed cost to an asset that already cannot price.
For a midscale operator in Na Jomtien specifically, the position is sharper still. The zone is upscaling around them. New luxury resort supply is lifting the area's ADR profile while their own segment faces compression. Competing on covers against a new branded resort with a purpose-built product is a fight on unfavourable ground.
The regional numbers behind the recovery
Some context on where the market came from, with dates attached, because the picture moved quickly.
C9 Hotelworks reported that Eastern Thailand tourism revenue fell 4.6% year on year, from THB 392 billion to THB 374 billion. That is regional tourism receipts across the whole economy, not hotel revenue. Over the same period hotel occupancy held steady, at 73.6% across Eastern Thailand and 80.5% across Chonburi. C9's reading is that hotels leaned on volume rather than pricing, with limited ability to push rate in a price-sensitive environment.
The mix explains it. Between January and November 2025, international arrivals to Eastern Thailand fell 11.2% to 10.8 million while domestic arrivals rose 5.5% to 36.9 million. A domestic visitor spends an average of THB 7,845 against THB 18,675 for an international one, so the replacement guest carried well under half the spending power.
Colliers' H1 2026 data shows that dynamic reversing at the top of the market, with international demand returning and rate leading growth. It has not reversed evenly. The recovery is concentrated in luxury, upper-upscale and the premium resort corridors.
On supply, C9 listed approximately 3,470 pipeline keys across Eastern Thailand as of January 2026, several with delivery dates still to be confirmed. Pipeline is not delivered supply, but the direction is clear, and Colliers notes new supply entering South Pattaya and Jomtien is already intensifying competition in exactly the segments with the least pricing power.
Thailand already earns a quarter of its revenue from F&B
Krungsri Research puts the Thai hotel revenue mix at roughly 65% to 70% rooms, around 25% food and beverage, and 5% to 10% from other sources including retail rental. Four and five star properties run a higher F&B share.
Thailand is not an underdeveloped F&B market waiting to be woken up. A quarter of revenue is already there. The marginal outlet is genuinely marginal, competing with the outlets already running for the same in-house guest.
Two Thai factors make the flow-through worth calculating rather than assuming. Affordable labour has historically narrowed the gap between rooms and F&B contribution here, which is part of why F&B sits comfortably at a quarter of the mix. Krungsri flags minimum wage increases and service sector labour shortages among the structural pressures through 2028, so the thing that softened the gap is getting more expensive.
And in a beach resort the guest can eat very well for very little five minutes from the gate. Weak dinner capture in that setting is a pricing and positioning problem, not a seating problem.
In a resort market, dwell is not the scarce resource
The dwell thesis was built for urban lifestyle hotels. A city centre guest has a city pulling them out of the door, so holding them in the lobby for another thirty minutes has obvious commercial logic.
Reverse that in Na Jomtien, Jomtien or Pratumnak.
A leisure resort guest usually has substantial discretionary time on or around the property. Dwell hours are not scarce in the way they are for a business traveller with a meeting schedule. What is scarce is rate, and what is untested at most properties is how much of the time already spent on site converts to spend at a margin worth having.
The commercial question is capture and contribution. What proportion of in-house guests take breakfast, lunch, dinner and drinks on property, at what average check, and at what departmental contribution after the space is paid for.
The design failure we see most often here
The following is Signa's professional position based on reviewing resort assets and development briefs across Thailand and the wider region. It is not a published industry statistic.
The recurring pre-opening error we encounter is not too little F&B. It is too much.
A resort of around 160 keys gets specified with three outlets at brief stage. An all-day dining venue, a speciality restaurant and a beach bar. It reads correctly in the feasibility narrative. In practice two of the three rarely trade near capacity outside peak weeks, and all three carry fixed labour, fixed space, fixed kitchen infrastructure and fixed maintenance for the life of the asset.
In a market where occupancy concentrates at weekends, as Colliers reports for South Pattaya and Jomtien, that problem is sharper than the annual average suggests. An outlet sized for Saturday is idle on Tuesday and carries its cost base all week.
Because labour has historically been affordable here, the drag does not present as an obvious crisis. It sits in the P&L for years as a below-benchmark departmental margin and a heavy undistributed cost line. Owners often accept it as normal for the asset class.
It is not normal. It was a decision, and it was made at the brief.
That decision is close to irreversible once the building is up. Converting a redundant speciality restaurant into function space or leasable area is a capital expenditure exercise, not an operational fix. This is why outlet count, seat count and kitchen sizing belong in the owner's review of the design brief, alongside key count and room mix.
Where dwell design does pay in this region
The argument is not that dwell design is worthless. It is that the properties where it pays are specific.
Dwell investment tends to justify itself in:
- luxury and upper-upscale resorts with rising ADR and a destination outlet that draws external demand as well as house guests;
- Bangkok, Ho Chi Minh City and Jakarta city hotels where the guest has genuine alternatives within walking distance;
- corporate and MICE assets where delegate time on property is contractually structured, which increasingly includes Eastern Seaboard properties serving EEC business demand;
- extended stay and serviced apartment product where the guest is resident rather than transient; and
- assets where a bar or lounge has measurable external capture, not only in-house capture.
In those cases the seating, the connectivity and the reason to move from lobby to bar are legitimate revenue infrastructure.
In a midscale beach resort with compressed ADR and weekend-weighted occupancy, the same spend often buys capacity that was never the binding constraint.
Five questions before you sign off the brief
1. Can the dwell actually be created, and is it capture you are short of?
Ask for in-house capture by meal period at comparable properties in the same market and the same zone. If dinner capture is weak, establish why guests leave. If they leave on price, seating will not hold them.
2. What does the incremental revenue flow through at?
Model rooms and each non-room department separately, on an incremental basis. Departmental contribution, then space allocation, then undistributed cost. A total revenue forecast without a flow-through forecast is not a business case.
3. Have you exhausted rate first?
Pattaya's own H1 2026 data shows growth coming from ADR at the top of the market. If there is unrealised rate in the asset through positioning, renovation, segmentation or distribution, that is cheaper contribution than any outlet will produce.
4. Whose wallet are you designing for, and on which days?
Model against the guest you actually have, in your zone. Weekend-weighted domestic demand at a lower average spend will not fill an outlet specified for a seven-night international guest.
5. What is the exit if it does not trade?
Third party lease, franchise, seasonal closure or conversion. If there is no exit, the risk sits entirely with the owner for the life of the asset.
What to measure
RevPAG on its own is a top line metric wearing the clothes of a profit metric. Used alone it will justify almost any addition to the property.
An owner should track it alongside:
- GOPPAR and GOP margin, which measure operating profitability far better than any revenue metric;
- capture rate by outlet and meal period, split weekday and weekend;
- average check by source market rather than blended;
- revenue per available seat hour;
- incremental contribution by department;
- undistributed cost per available room; and
- the share of outlet revenue coming from external rather than in-house demand.
The final denominator is space and capital
This is a design decision, so the analysis cannot stop at RevPAG, departmental margin or even GOPPAR.
An outlet occupies a footprint and consumes capital. The relevant measures are contribution per square metre, break-even covers by meal period, peak seat utilisation, incremental GOP against outlet capital expenditure, and the return on that capital measured against the next best use of the same space.
An outlet can lift RevPAG, lift absolute GOP and still destroy value, because the same 300 square metres and the same THB 20 million would have earned more as additional keys, function space, leased retail or a smaller-format concept.
The design question is not whether the outlet makes money. It is whether that square metre and that baht of capital make more money there than anywhere else on the site.
If RevPAG rises, value has only been created when the resulting incremental cash profit delivers an acceptable return on the capital and the space committed to producing it. Revenue growth is evidence of activity. It is not, by itself, evidence of value creation.
Frequently asked questions
Is length of stay the same as dwell time? No, and conflating them causes bad decisions. Length of stay measures nights booked. Dwell measures hours spent inside monetisable hotel space. A short stay can still involve high on-property dwell, and a long stay can involve very little. They need to be measured and addressed separately.
How is the Pattaya hotel market performing? Colliers Thailand recorded 72.7% occupancy, ADR of THB 3,663 and RevPAR of THB 2,652 in the first half of 2026, with RevPAR up 7.79% year on year. Colliers describes the market as moving from volume-driven recovery to pricing-led premiumisation, led by luxury and the emerging resort zones.
Which Pattaya zone is performing best? North Pattaya and Wongamat recorded 77.0% occupancy, above the city average, on luxury-led demand. Na Jomtien is identified as the emerging premium resort corridor with the strongest medium-term ADR growth potential. South Pattaya and Jomtien form a competitive midscale cluster with RevPAR trailing other zones.
Is dwell time a useful hotel metric at all? Yes, in the right segment. It is a strong diagnostic for city centre, lifestyle, corporate and extended stay assets, and for luxury resorts with genuine destination outlets. It is far weaker in midscale beach resorts where the guest already has discretionary time and leaves on price rather than on boredom.
What is RevPAG? Revenue per available guest. It divides property revenue by guests rather than by rooms, so it captures non-room spend that RevPAR ignores. The term is not fully standardised and some sources use TRevPAG for the total revenue version. It is a useful supplementary metric and a poor substitute for a profit metric.
Why does a rate increase beat outlet revenue on contribution? Because a room that is already sold costs the same to service at a higher rate. Commission and card fees scale with revenue, but most of a rate premium reaches departmental profit. Outlet revenue carries product cost on every cover, step-variable labour, and the fixed cost of kitchen and seating space whether it trades or not.
How much of a Thai hotel's revenue comes from food and beverage? Krungsri Research puts it at around 25%, with rooms at 65% to 70% and other sources at 5% to 10%. Four and five star properties generally run a higher F&B share than smaller hotels.
When should an owner review the F&B brief? Before the design is fixed. Outlet count, seat count and kitchen sizing are effectively permanent once construction begins. Reviewing them after opening means funding a capital solution to a planning problem.
Related F&B revenue management analysis
Read the companion operational analysis: The Constraint Is Capture: F&B Revenue Management for Thai Hotels and Resorts
Sources and methodology
Facts were reviewed on 9 August 2026. Pattaya market performance and zone analysis are drawn from Colliers Thailand's Pattaya Hotel Market snapshot for the first half of 2026, published July 2026, and are cited with attribution. Eastern Thailand regional figures are from C9 Hotelworks' Eastern Thailand Hotel and Tourism Market Outlook 2025/2026, published January 2026; the Pattaya length of stay figure in that report is dated 2024 and the arrivals data covers January to November 2025. Regional tourism revenue is not hotel revenue and is described as such. Thai revenue mix and cost pressures are from Krungsri Research's hotel industry outlook published January 2026. Departmental contribution is described structurally rather than benchmarked, because the ratio is property specific and should be modelled from the owner's own accounts. Observations about design briefs in Thailand are Signa's professional position and are identified as such in the text.
- Colliers Thailand, Pattaya Hotel Market: Growth in Prime Segments, H1 2026
- C9 Hotelworks, Eastern Thailand Hotel and Tourism Market Outlook 2025/2026
- Krungsri Research, Industry Outlook 2026 to 2028, Hotel Business
- Path Intelligence, research conducted 2007 in collaboration with MIT. Summarised at Retail Sensing
- Journal of Air Transport Management: Shopping or dining, on passenger dwell time and non-aeronautical revenues
Signa Hotel Advisors provides independent hotel asset management, pre-opening supervision, feasibility review and owner representation across Thailand and Southeast Asia, with senior presence in Pattaya and Bangkok.
Continue reading
- Reviewing Your Annual Hotel Budget: An Owner's Checklist
- 10 Numbers Every Hotel Owner Should Check in the Monthly Report
- The Budget That Arrives After You Sign: What Hotel Owners Are Never Told About Brand Costs
- Hotel Loyalty Programmes: What Owners Need to Test Before Signing
- Book Direct, But Who Captures the Value?
- Hotel Operator Selection in Thailand: An Owner's Guide
- Hotel Feasibility Study in Thailand: An Investor's Guide
- Hotel Asset Management in Thailand: An Owner's Guide
- Signa hotel pre-opening supervision & asset management services
- The Constraint Is Capture: F&B Revenue Management for Thai Hotels and Resorts
Need a confidential review of your hotel?
Signa Hotel Advisors represents hotel owners across Thailand and Southeast Asia on asset management, feasibility, operator selection and HMA negotiation.
Speak with our team